Your Network's Edge®
Blog Post
You are here
What is Explainable AI?
These days, it seems that artificial intelligence (AI) has finally taken over. Wherever we turn, we hear about generative AI, ChatGPT, Bard, Midjourney, and other tools. Almost every organization has its own AI ambitions of what their AI will look like, or they are already employing it. Some companies are even going as far as to rebrand their old rule-based engines as AI-enabled.
As more firms embed AI and sophisticated analytics into business processes and automate decisions, the need for transparency into how these models generate decisions develops, along with the question of how we achieve this transparency while leveraging the benefits of AI. This is where Explainable AI (XAI) can assist.
Predictive vs Explanatory Models in Business Decision-Making
We could ask ourselves what the correlation is between seeing something coming and explaining why it is happening. The scientific laws held as the gold standard by all, such as Newton's Law of Gravitation, are both predictive and explanatory. Your next question might be, how does that relate to business? The answer is that business executives aspire to understand their decisions the same way we comprehend gravity. For that reason, predictive models are designed to forecast future outcomes, such as financial results. This includes predicting how much extra revenue the business could expect if a certain strategy is implemented.
Predictive models prioritize accuracy over causal inference and do not provide insights into the underlying reasons why something will happen. On the other hand, explanatory models are designed to explain and give reason as to why an event will occur. This can include why a new business strategy either failed or didn’t improve the business as much as expected.
Explanatory models prioritize providing a causal explanation of results over forecast accuracy. Predictive models are about whether something will happen and to what extent, whereas explanatory models are all about the why.
It's paramount to understand the difference between both models, to avoid creating models that are neither highly explanatory nor highly predictive.
In a technical sense, predictive models aim to minimize bias and estimation error. Explanatory models minimize bias while being able to provide casual explanation of results, even if they sacrifice estimation error.
When businesses mix up or confuse predictive accuracy with explanatory power, it could lead to models that are neither very explanatory nor very predictive.
What makes a model explanatory?
Some AI and machine learning (ML) models are more likely to be explanatory, whereas others are not. Some ML/AI models explanatory models, in general, are intended to provide insights into the underlying mechanisms for the model's predictions. They are simple to comprehend and analyze and may favor providing a causal explanation for results over forecast accuracy. Below are some aspects by which we can assess whether a model is explanatory:
- Transparency and simplicity:
An explanatory model should be straightforward to grasp. It should avoid complexity and employ interpretable algorithms or models that provide clear insights into the decision-making process. - Feature importance:
An explanatory model should provide information on the importance of various features in making predictions. Therefore, it's essential to identify the attributes that influence the final decision, as this may assist in understanding the model's behavior. - Feature relationships:
Explanatory models should reveal the relationships between features and the target variable. They should show how changes in feature values affect the predictions and provide insights into the direction and magnitude of these effects. - Intuitive and meaningful explanations:
Explanatory models should be able to provide insights that are intuitive and meaningful to domain experts or end-users. The explanations should align with the domain knowledge and provide insights that can be easily interpreted and understood. - Visualizations:
Visualizations are critical in making a model explainable. Graphs, charts, decision trees, and other visual representations of the model's behavior, feature relevance, and linkages might aid comprehension. - Contextual interpretation:
Explanatory models must consider the context in which they are used. They should include explanations that are pertinent to the problem domain or application. - Model validation:
To ensure reliability and broad applicability, it is essential to extensively validate an explanatory model. Hence, cross-validation, sensitivity analysis, and permutation importance are validation procedures that can help examine the model's stability and the robustness of its explanations. - Human-AI interaction:
For a model to be fully explanatory, it should allow for human-AI interaction. This includes making interactive interfaces available to users, allowing them to explore and adjust inputs and parameters, and getting feedback to refine and improve the model's explanations.
Explaining Models: Types and behavior
To explain the model involves offering insights and interpretations about how the model behaves, its forecasts, and its decision-making process.
Here are examples of models and approaches to explaining them:
1. Linear Regression:
- Coefficient interpretation: In linear regression, the coefficients associated with each feature represent the impact of that feature on the target variable, which is the phenomena we want to predict. are values that describe the relationship between a predictor variable and the response variable and are used to predict the value of an unknown variable using a known variable. Positive coefficients indicate a positive relationship, while negative coefficients indicate a negative relationship.
- Feature importance: By examining the magnitude of the coefficients, you can determine the relative importance of distinctive features in the model.
2. Decision Trees:
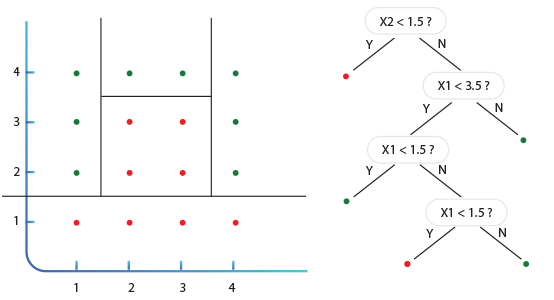
- Rule-based explanations: Decision trees are naturally interpretable. You can explain the model by traversing the tree, describing the conditions at each split, and showing the path that leads to a particular prediction.
- Feature importance: The importance of features in decision trees can be measured by how much they contribute to reducing the impurity or splitting the data. Purity is a statistic element that is used to determine whether a node should be divided. When a node's data is evenly split 50/50, it is 100% impure, and when all its data belongs to a single class, it is 100% pure.

In the figure above we can see that the splits at the top get more impure, which causes us to isolate more red circles. Four circles are isolated at one split. We would isolate fewer circles (red or green) if we chose a different query (path).
-
Visualizations: Visualizing the decision tree structure can aid in understanding the model's decision-making process.
3. Random Forests and Gradient Boosting Models:
Random Forest:
Random Forest is an ensemble of decision trees, where each tree is trained on a different subset of the data. This model provides feature importance and can also provide insights into the interactions between features and their combined effect on the predictions.
4. Gradient Boosting algorithms (that include also XGBoost and LightGBM)
Gradient Boosting is another ensemble method that combines multiple weak learners (typically decision trees) to create a strong predictive model.
Gradient Boosting assigns importance to features based on their ability to improve the model's loss function.
The feature importance is calculated by summing up the contribution of each feature across all the trees in the ensemble.
It can also reveal complex relationships between features and the target variable.
5. Support Vector Machines (SVM):
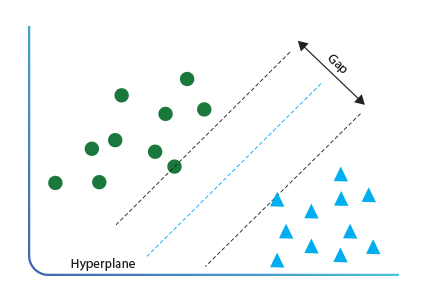
- Hyperplane: SVM separates classes with a hyperplane in a high-dimensional space. In SVM, a hyperplane is a decision boundary that helps classify data points, and it is a line or plane that separates the data into classes, as can be seen in the diagram below:

The optimal hyperplane is the one that maximizes the margin between the closest data points from both classes. The model can be explained by visualizing the hyperplane and describing how it separates the classes. - Support vectors: These are the data points closest to the decision boundary. By analyzing them, we can gain insights into the data distribution and the decision boundaries of the SVM model. Let's say we have a dataset with two classes, red and blue, and we want to classify new data points based on their features. We can use SVM to find the optimal hyperplane that separates the two classes. The optimal hyperplane is the one that maximizes the margin between the closest data points from both classes. Support vectors are the data points that are closest to the hyperplane and have the largest influence on the position and orientation of the hyperplane. By identifying the support vectors, we can understand which data points are most important for the classification decision. The position and orientation of the hyperplane can be visualized using the support vectors, which can help in understanding how the SVM model works.
6. Neural Networks:
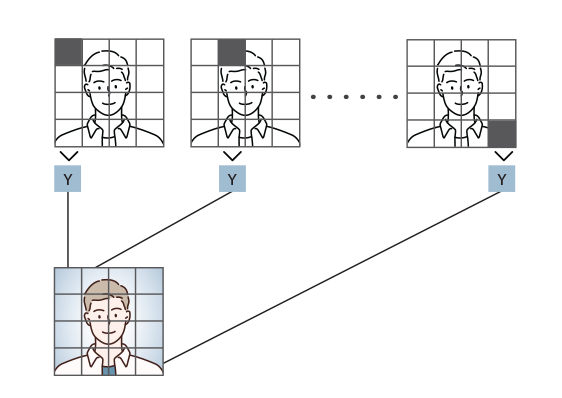
- Feature relevance: Techniques such as gradient-based methods, saliency maps for image processing, or occlusion analysis can help identify which features are most relevant to the model's predictions. These methods are used to identify which features are most relevant to the model's predictions in image processing. They work by analyzing the input image and computing the gradient of the prediction (or classification score) with respect to the input features. Gradient-based methods generate a saliency map that highlights the most important pixels in the image, while saliency maps are visualizations that highlight the most important regions of an image for a given model's prediction. Occlusion analysis involves systematically occluding parts of the input image and observing the effect on the model's prediction. By comparing the model's predictions with and without occlusion, we can identify which parts of the image are most important for the model's prediction. These techniques are used to provide insights into the model's decision-making process and to improve the model's performance.

-
Layer activations: Examining the activations of hidden layers (the layers in between the input and the output layers in deep learning architecture modeling) can provide insights into the model's learned representations and feature hierarchies.
7. Rule-based Models (e.g., Association Rules):
- Rule extraction: These models generate rules that explicitly describe associations or patterns in the data. These rules can be interpreted and explained by presenting them in a human-readable format, as opposed to equations, for example.
- Rule support and confidence: Metrics like support and confidence can quantify the strength and reliability of the rules.
8. Bayesian Networks:
Probabilistic inference: Bayesian networks represent dependencies among variables and enable probabilistic inference. Explaining the model involves analyzing the network structure, conditional probabilities, and performing inference to explain reasoning and predictions.
Now that we understand what is model explainability, and after reviewing the various explaining models, the insights they provide and the differences between them, our next step would be to look behind the hidden layers of Deep Learning and see how these models are implemented in real use cases. I’ll be covering this on part 2 of the blog. Stay tuned…

